0 · 1 · 1 · 2 · 3 · 5 · 8

GENOMICS
From transcription to the research data.
Transcription factors bind to locations on DNA and help regulate gene expression. Explore the process, inspect the binding-site data and read the research.
Sound Atlas
POSSIBLE FIBONACCI STRUCTURES
Explore the evidence for music, auditory stimulation and molecular responses.
SEQUENCE STRUCTURE
RELATIONSHIP
POSSIBLE FIBONACCI STRUCTURES
Explore the evidence for music, auditory stimulation and molecular responses.
MUSIC ATLAS · MEASUREMENT ARCHITECTURE
Validating the research approach for stakeholders before a substantial investment in mRNA sequencing.
Our hypothesis: does electronic music modulate OXTR via Fibonacci numbers? Our initial non-invasive study, N = 33, brings physiology, audience experience and musical structure together to validate the research approach and establish the case for mRNA sequencing investment.
These graphics are visual mockups of a real Universal Informatics Music Atlas Python script: custom software Ben Korbel is developing with Gemini to measure and unify these metrics together as one. Implementation is in progress.
EEG from Muse S Athena, galvanic skin response (GSR / EDA), heart-rate variability, HRV power spectral density (PSD) and baroreflex sensitivity. Brain-state analysis brings amplitude and phase–amplitude coupling onto the shared timeline.
A 400-channel laboratory hyperspectral analysis and smartphone-grade RGB analysis reconstructed into 31 spectral bands. Inferred oxytocin is an exploratory model output created by Immersion Neuroscience via research with DARPA. Explore Immersion Neuroscience ↗ and SIX ↗.
Continuous audience feedback and a participant peak-moment trigger, aligned with real-time song analysis: position within a 64-bar sequence, melodic anticipation and resolution, chords, arpeggios, and Fibonacci / Pisano landmarks.
The landscape overview brings the streams together, from EEG at the top to Fibonacci coding at the bottom.
Brain state, amplitude and coupling alongside audience peaks, cardiovascular features and spectral imaging.
The vertical view begins with EEG and aligns the measurement streams around an audience-reported peak moment.
NEXT STAGE · mRNA SEQUENCING
Following validation of the research approach through the N = 33 non-invasive study, we will invest in mRNA sequencing through the Kinghorn Centre for Clinical Genomics at the Garvan Institute of Medical Research ↗, from whom we have received a commercial quote.
mRNA sequencing represents an investment of A$600–A$1,000 per participant. The initial non-invasive phase establishes the case for that investment for stakeholders. Sequencing will compare OXTR mRNA expression in samples collected before and after the intervention or song.
| Order | Figure | Description | Image |
|---|---|---|---|
| 1 | 01 · Unified measurement timeline The landscape overview brings the streams together, from EEG at the top to Fibonacci coding at the bottom. | Illustrative landscape timeline, from EEG at the top through HRV PSD, baroreflex, GSR, inferred hormone placeholders, rhythm and melodic resolution to Fibonacci coding at the bottom. | media/music-measurement/unified-timeline.jpeg |
| 2 | 02 · Brain state, amplitude & coupling Brain state, amplitude and coupling alongside audience peaks, cardiovascular features and spectral imaging. | Illustrative dashboard with EEG phase–amplitude coupling, an audience response timeline, a Fibonacci/Pisano clock, HRV PSD, baroreflex features, an inference network and a hyperspectral cube. | media/music-measurement/brain-state-dashboard.jpeg |
| 3 | 03 · A peak moment across the streams The vertical view begins with EEG and aligns the measurement streams around an audience-reported peak moment. | Illustrative vertical stack beginning with EEG, followed by GSR, HRV PSD, baroreflex, an inferred oxytocin placeholder, laboratory and RGB spectral views, audience feedback, musical structure and Fibonacci coding. | media/music-measurement/peak-moment-timeline.jpeg |
A four-bar phrase doubles to 8, 16, 32, 64 and 128 bars. Reducing each length modulo 9 gives a repeating six-value cycle.
4 → 8 → 7 → 5 → 1 → 2
Phrase length in bars, mapped onto the nine positions of the Beta circle.
In 4/4, each bar contains four quarter-note beats. Here the numbers count bars in a phrase. Doubling is the structural choice being explored.
| Bars | Calculation |
|---|---|
| 4 | 4 = 9 × 0 + 4 |
| 8 | 8 = 9 × 0 + 8 |
| 16 | 16 = 9 × 1 + 7 |
| 32 | 32 = 9 × 3 + 5 |
| 64 | 64 = 9 × 7 + 1 |
| 128 | 128 = 9 × 14 + 2 |
The M9 / P24 Beta cycle is 1, 2, 4, 8, 7, 5. Starting at 4 rotates the same cycle to 4, 8, 7, 5, 1, 2.
Within the Atlas, Beta is calculated by summing the Alpha values strictly between successive Gamma positions and reducing modulo 9. These two calculations produce the same six-value cycle.
| Phrase length (bars) | Quotient on division by 9 | Remainder |
|---|---|---|
| 4 | 0 | 4 |
| 8 | 0 | 8 |
| 16 | 1 | 7 |
| 32 | 3 | 5 |
| 64 | 7 | 1 |
| 128 | 14 | 2 |
Select the first, third and fifth degrees of C major, then repeat the tonic at the octave: C, E, G, C. These degree numbers are selected Fibonacci numbers.
1 · 3 · 5 · 8
C · E · G · C
The piano and circle highlight the same values: 1, 3, 5 and 8. Blend Alpha to reveal the full M9 / P24 sequence.
The Fibonacci sequence begins 0, 1, 1, 2, 3, 5, 8…. The chord selects degrees 1, 3, 5, 8; these are selected values within the sequence.
The circle keeps all 24 Alpha positions in their original order. Every occurrence of 1, 3, 5 or 8 is highlighted, synchronised with its piano key. Repeated values stay at their separate positions. Blend Alpha to reveal the remaining values; this is a comparison of scale-degree numbers with sequence values.
A major triad is degrees 1, 3 and 5. Degree 8 repeats its root one octave higher.
| Degree | Just ratio | 12-TET ratio |
|---|---|---|
| 1 | 1 | 1 |
| 3 | 5/4 | 1.25992 |
| 5 | 3/2 | 1.49831 |
| 8 | 2 | 2 |
12-TET means twelve equal divisions of the octave. Its frequency ratio after n semitones is 2^(n/12). Just intonation gives the chord the proportional frequencies 4 : 5 : 6 : 8.
| Scale degree | Note | Semitones above C | Just ratio | 12-TET ratio |
|---|---|---|---|---|
| 1 | C | 0 | 1 | 1 |
| 3 | E | 4 | 5/4 | 1.2599210498948732 |
| 5 | G | 7 | 3/2 | 1.4983070768766815 |
| 8 | C | 12 | 2 | 2 |
Place the tonic at the centre and the six other notes of its major scale around it. Trace the hexagon, then return to the centre.
1 tonic + 6 notes = 7
2 · 2 · 1 · 2 · 2 · 2 · 1
Six scale notes surround the tonic. Blend Gamma to compare the six positions; blend Alpha to see their place in the full period.
The seven distinct notes of C major are C D E F G A B. C at the centre leaves six notes on the perimeter.
The steps from one note to the next, including the return to C, are 2, 2, 1, 2, 2, 2, 1 semitones. Equal distances in the drawing represent positions in the arrangement.
Move from C major to G major and six note names remain: C D E G A B. F changes to F♯.
The Gamma overlay uses the Atlas positions 24, 4, 8, 12, 16, 20, with Alpha values 9, 3, 3, 9, 6, 6. These six equally spaced positions align with the six scale notes around the tonic. Gamma also joins alternating vertices into two opposing equilateral triangles, forming the six-pointed star within the hexagon. The note names and the modular values remain visible as separate labels.
Blend Alpha to reveal all 24 positions. We hypothesise that these are possible Fibonacci structures within M9 / P24. The overlay makes the proposed spatial relationship available for inspection.
| Degree | Note | Semitones above tonic | Placement |
|---|---|---|---|
| 1 | C | 0 | Centre |
| 2 | D | 2 | Perimeter 1 |
| 3 | E | 4 | Perimeter 2 |
| 4 | F | 5 | Perimeter 3 |
| 5 | G | 7 | Perimeter 4 |
| 6 | A | 9 | Perimeter 5 |
| 7 | B | 11 | Perimeter 6 |
Follow the twelve chromatic pitch classes around the circle and across the keyboard. From C to the next C, five black keys sit alongside eight white keys.
2 + 3 = 5
5 + 8 = 13
13 keys from C to C, including the repeated upper C. The circle contains 12 distinct pitch classes.
The chromatic scale includes every semitone in the octave. On the circle, the seven natural notes C D E F G A B are white; the five black-key notes C♯ D♯ F♯ G♯ A♯ are pink. Sharp spellings are used here; on an equal-tempered keyboard these keys also have flat names.
The major-scale steps are 2, 2, 1, 2, 2, 2, 1 semitones. A black key fills each two-semitone gap. E–F and B–C are already one semitone apart, creating the familiar groups of two and three black keys.
2 + 3 = 5 counts the black keys. 5 + 8 = 13 counts all keys from C to C, including both endpoints. The numbers 2, 3, 5, 8, 13 are consecutive Fibonacci numbers. This is a counting pattern in the illustrated keyboard span, not a derivation of chromatic tuning.
The upper C has twice the frequency of the lower C and belongs to the same pitch class. Without the repeated endpoint, there are 7 + 5 = 12 pitch classes. Choosing different endpoints changes the colour counts: C♯ to C♯ contains seven white keys and six black keys.
The circle uses twelve-tone equal temperament: every adjacent step has frequency ratio 2^(1/12). Equal angles represent equal semitone intervals. The separate Circle of fifths view explains pure 3:2 fifths, octaves and the tuning adjustment that closes the twelve-note circle.
Scales and scale degrees · Open Music Theory ↗
Notes, frequencies and equal temperament · UNSW ↗
| Semitones above C | Note | Key colour | Circle pitch-class index |
|---|---|---|---|
| 0 | C | White | 0 |
| 1 | C♯ | Black | 1 |
| 2 | D | White | 2 |
| 3 | D♯ | Black | 3 |
| 4 | E | White | 4 |
| 5 | F | White | 5 |
| 6 | F♯ | Black | 6 |
| 7 | G | White | 7 |
| 8 | G♯ | Black | 8 |
| 9 | A | White | 9 |
| 10 | A♯ | Black | 10 |
| 11 | B | White | 11 |
| 12 | C | White | 0 |
Pythagorean tuning, traditionally attributed to Pythagoras, builds a scale from 3:2 fifths and 2:1 octaves. Bring the notes into one octave and order them by pitch: C, D, E, F, G, A, B. Repeat C above them to complete the eight-note scale.
Perfect fifth: 3 : 2
Octave: 2 : 1
Pythagorean tuning builds seven distinct scale notes using fifths and octaves. The eighth note repeats the first, one octave higher.
The tuning system named after Pythagoras constructs a scale using two operations: multiply by 3/2 for a fifth, then divide by 2 when the note lies above the octave.
Starting from F, the chain F → C → G → D → A → E → B contains the C-major collection. Ordering those notes by pitch gives C D E F G A B.
In twelve-tone equal temperament each fifth is 2^(7/12) ≈ 1.49831. Twelve steps return to the same pitch class.
Twelve pure 3:2 fifths exceed seven octaves by 531441/524288 ≈ 1.01364. This small difference is the Pythagorean comma.
The numbers in 2:1 and 3:2 are consecutive Fibonacci numbers. This is the numerical relationship explored here.
3/2 is one ratio of successive Fibonacci numbers. The sequence 3/2, 5/3, 8/5, 13/8… approaches the Phi Ratio. Repeating the fixed ratio 3/2 is a separate operation.
Pythagorean tuning: method and ratios ↗
Pythagoras: historical attribution ↗
| Fifth step | Pitch class | Semitones modulo 12 | 12-TET frequency ratio within one octave |
|---|---|---|---|
| 0 | C | 0 | 1 |
| 1 | G | 7 | 1.4983070768766815 |
| 2 | D | 2 | 1.122462048309373 |
| 3 | A | 9 | 1.681792830507429 |
| 4 | E | 4 | 1.2599210498948732 |
| 5 | B | 11 | 1.8877486253633868 |
| 6 | F♯ / G♭ | 6 | 1.4142135623730951 |
| 7 | D♭ | 1 | 1.0594630943592953 |
| 8 | A♭ | 8 | 1.5874010519681994 |
| 9 | E♭ | 3 | 1.189207115002721 |
| 10 | B♭ | 10 | 1.7817974362806785 |
| 11 | F | 5 | 1.3348398541700344 |
Compare the proposed M9 shapes for 528, 111 and 7.38 Hz. Choose the reference frequency for A4 to see the scale frequencies change while their interval ratios stay the same.
f = A4 × 2^((n − 9)/12)
528 → 6: hexagon · 111 → 3: triangle · 7.38 → 9: circle. A proposed visual mapping from the written frequency in hertz.
The reference sets A4 to 432, 440 or 444 Hz. Every equal-tempered note follows the same ratio rule. Here n is the number of semitones above C4.
Relative to A4 = 440 Hz, A4 = 432 Hz shifts every note by approximately −31.77 cents. A4 = 444 Hz shifts every note by approximately +15.67 cents. One semitone is 100 cents.
The separate 528 Hz tone is included as a named solfeggio-frequency example. A single tone does not define the tuning of a whole piece.
For the M9 diagrams, add the digits of the frequency written in hertz, omitting the decimal point, and reduce the sum modulo 9, displaying zero as 9: 528 → 15 → 6, 111 → 3, 7.38 → 18 → 9. For 7.38 Hz, this operates on its written digits: 7 + 3 + 8 = 18. The visual presets associate 6 with a hexagon, 3 with a triangle and 9 with the circle. They show the proposed mapping; the shapes are not waveforms.
Changing the tuning reference preserves relative intervals. The research question is whether these stimulus settings modulate emotional and biological responses.
| Frequency (Hz) | Written digits | Digit sum | M9 displayed value | Visual preset |
|---|---|---|---|---|
| 528 | 5 + 2 + 8 | 15 | 6 | hexagon |
| 111 | 1 + 1 + 1 | 3 | 3 | triangle |
| 7.38 | 7 + 3 + 8 | 18 | 9 | circle |
| A4 reference (Hz) | Note | Semitones above C4 | Frequency (Hz) |
|---|---|---|---|
| 432 | C | 0 | 256.86873684058776 |
| 432 | D | 2 | 288.3254085007274 |
| 432 | E | 4 | 323.6343286053632 |
| 432 | F | 5 | 342.8786272251311 |
| 432 | G | 7 | 384.8682462366266 |
| 432 | A | 9 | 432 |
| 432 | B | 11 | 484.90360486964914 |
| 432 | C | 12 | 513.7374736811755 |
| 440 | C | 0 | 261.6255653005986 |
| 440 | D | 2 | 293.6647679174076 |
| 440 | E | 4 | 329.6275569128699 |
| 440 | F | 5 | 349.2282314330039 |
| 440 | G | 7 | 391.99543598174927 |
| 440 | A | 9 | 440 |
| 440 | B | 11 | 493.8833012561241 |
| 440 | C | 12 | 523.2511306011972 |
| 444 | C | 0 | 264.00397953060406 |
| 444 | D | 2 | 296.33444762574766 |
| 444 | E | 4 | 332.6241710666233 |
| 444 | F | 5 | 352.4030335369403 |
| 444 | G | 7 | 395.55903085431066 |
| 444 | A | 9 | 444 |
| 444 | B | 11 | 498.3731494493616 |
| 444 | C | 12 | 528.0079590612081 |
MUSIC ATLAS · MEASUREMENT ARCHITECTURE
Validating the research approach for stakeholders before a substantial investment in mRNA sequencing.
Our hypothesis: does electronic music modulate OXTR via Fibonacci numbers? Our initial non-invasive study, N = 33, brings physiology, audience experience and musical structure together to validate the research approach and establish the case for mRNA sequencing investment.
These graphics are visual mockups of a real Universal Informatics Music Atlas Python script: custom software Ben Korbel is developing with Gemini to measure and unify these metrics together as one. Implementation is in progress.
EEG from Muse S Athena, galvanic skin response (GSR / EDA), heart-rate variability, HRV power spectral density (PSD) and baroreflex sensitivity. Brain-state analysis brings amplitude and phase–amplitude coupling onto the shared timeline.
A 400-channel laboratory hyperspectral analysis and smartphone-grade RGB analysis reconstructed into 31 spectral bands. Inferred oxytocin is an exploratory model output created by Immersion Neuroscience via research with DARPA. Explore Immersion Neuroscience ↗ and SIX ↗.
Continuous audience feedback and a participant peak-moment trigger, aligned with real-time song analysis: position within a 64-bar sequence, melodic anticipation and resolution, chords, arpeggios, and Fibonacci / Pisano landmarks.
The landscape overview brings the streams together, from EEG at the top to Fibonacci coding at the bottom.
Brain state, amplitude and coupling alongside audience peaks, cardiovascular features and spectral imaging.
The vertical view begins with EEG and aligns the measurement streams around an audience-reported peak moment.
NEXT STAGE · mRNA SEQUENCING
Following validation of the research approach through the N = 33 non-invasive study, we will invest in mRNA sequencing through the Kinghorn Centre for Clinical Genomics at the Garvan Institute of Medical Research ↗, from whom we have received a commercial quote.
mRNA sequencing represents an investment of A$600–A$1,000 per participant. The initial non-invasive phase establishes the case for that investment for stakeholders. Sequencing will compare OXTR mRNA expression in samples collected before and after the intervention or song.
Vision Atlas
Explore visual and ocular biology, light exposure, gene expression and the EMDR literature.
Research comparison · hypothesis under investigation
Are hexagonal animations more natural, human, and impactful for EMDR visual stimulation than traditional horizontal tracking green lights? We use the honeycomb conjecture as inspiration, where hexagonal packing is nature's most efficient division of space. Furthermore, many endogenous neurotransmitters, hormones, and nucleic bases natively utilise hexagonal configurations within their molecular architecture.
We hypothesise that a hexagonally structured saccadic tracking pattern imposes a distinct oculomotor and visual psychophysics load compared to standard linear tracking. We propose that the complex coordination required to navigate this geometric pattern optimises retinal and visual pathway signalling, thereby driving a downstream biological response that upregulates OXTR gene transcription (measured via mRNA sequencing) and enhances emotional regulation.
Language Atlas
From mantra and meditation to communication, psychotherapy and epigenomics.
Explore the original Mantra collection alongside recent molecular and clinical research.
Active recitation, mental practice and mindfulness, with gene expression, methylation and physiological outcomes identified separately.
Research on psychotherapy and molecular change, including trauma-focused therapy, cognitive behavioural therapy and narrative exposure.
A developing research question: how do interpersonal experiences relate to our epigenome? Whole-treatment associations remain distinct from effects of particular words.
Partners
Our research uses Wolfram for mathematical verification and Biopython for sequence analysis. OpenAI’s GPT and Google DeepMind’s Gemini support research exploration and development.
We are committed to open, transparent research, reproducible methods and sharing knowledge for the benefit of humankind.
A preliminary list of organisations and research communities we aspire to collaborate with:
Youth mental health research, early intervention and digital innovation.
Genomics, sequencing, bioinformatics and medical research.
Bioinformatics and computer vision.
Molecular research infrastructure and shared biological datasets.
Bioinformatics tools, reproducible workflows and research collaboration.
Discoverable, accessible and reusable research data.
Discovering research studies and sharing descriptions of future datasets.
Molecular data and models for mental health research.
Genetic evidence for understanding mental health conditions.
Brain gene expression and regulation, with relevance to our OXTR research.
Accessible molecular evidence for mental health research.
Molecular biomarkers for mental health.
Circadian rhythms, brain models and bipolar disorder research.
Computer vision, artificial intelligence and physics modelling.
About
 INFORMATICS
Bioinformatics platform for mental health
Investigating potential relationships between the Fibonacci sequence and OXTR gene expression.
Does modular compression reveal statistically significant patterns, or merely mathematical elegance?
Do the nested sequences within Fibonacci Pisano periods have biological and molecular implications?
Inspired by research into how geometric architectures and Fibonacci-ordered dynamics can protect quantum information, we are investigating whether geometry derived from Fibonacci Pisano periods can improve the computational efficiency of hyperspectral image analysis for genomics.
Science Advances · 2015
Toroidal geometry in neural activity ↗Nature · 2022
Science and Open Questions ↗If independent studies verify biological significance in the OXTR–Fibonacci relationship, we plan to extend the investigation to a wider set of candidate genes and molecular systems.
 Symbolic computation with Wolfram↗
Wolfram is our planned primary computational environment for symbolic geometry and future bioinformatic research.
Quantum Atlas makes computational biology and quantum research approachable through a scientific question written in ordinary language. A person brings the question; the platform coordinates AI scientific work, mathematical models, simulations, recorded quantum measurements and biological evidence, then returns an explanation with the underlying research record.
The purpose is to help people investigate whether a proposed pattern adds useful information to a biological problem. The current OXTR investigation asks whether Fibonacci, Phi Ratio and M9 P24 representations can help predict where proteins associate with DNA. That study is the first worked investigation within the wider natural-language research experience.
You can ask Quantum Atlas a biological research question without writing quantum code. Astra develops the supported investigation and explains the findings. Gemini reviews the design and the resulting report. Mathematical and computing tools supply calculations and measurements, while laboratory evidence provides a biological comparison. You can follow the stages, inspect the geometry, read the results in ordinary language and download the record. Your own AI can retrieve the public evidence through MCP or the API, or ask Universal One a research question through A2A. A persistent new study starts through the Quantum Atlas interface within its supported research scope.
| Feature | Purpose | Value for the person |
|---|---|---|
| Ask a question | Express the biological question in everyday language. The router identifies a supported calculation or a concrete missing capability. | A clear starting point without writing quantum code. |
| Study and live workflow | Show the question, scientific plan, agent progress and the role of each calculation or evidence source. | Understand what is happening and how each stage contributes. |
| Geometry explorer | Inspect Alpha, Beta, Gamma and Epsilon definitions and the different numerical preparations of the same DNA inputs. | See what is being compared before interpreting its response. |
| Design and findings reviews | Gemini checks the proposed method before calculations and checks the findings against the evidence before delivery. | See the review decision, requested corrections and retained evidence. |
| Classical results | Inspect calculation checks, CUDA-Q simulation results and the genomic prediction comparison. | Understand the computational baseline and what a prediction score means. |
| Quantum results and Compare | Inspect the recorded Aquila readings beside matched calculated and simulated values, with their counts and uncertainty. | Understand how the physical device behaved and how that relates to the research question. |
| Insights and next test | Return a direct answer, what was completed, the practical meaning, and the remaining research dependency. | Learn from the investigation and identify a useful next step. |
| Saved studies and downloads | Retain task progress and provide the complete report in JSON and CSV. The Wiki adds a Markdown reading guide. | Reopen work, inspect methods, discuss it with another AI or reproduce the analysis. |
| Shared capacity | Display the available question allowance and keep execution within the recorded scope and funding. | Know when the service can accept another investigation. |
| Drug Discovery Network and Open Source Genomic Insights | The planned fifth stage connects reviewed findings with external research collaborators and shareable genomic insights. | Understand the intended path from an investigation to research collaboration. This stage is marked as a future feature. |
Astra and Gemini have distinct scientific roles. LangGraph coordinates their work and the specialist calculation services through an explicit, persistent workflow. The diagram on the Quantum page presents the scientific handoffs: formulate, model, simulate and measure, compare with biological evidence, then interpret.
| Agent or service | Role | Work | Handoff |
|---|---|---|---|
| GPT-6 Astra | Head bioinformatician and scientist | Interprets the question, selects the supported study plan, coordinates the authorised calculations, responds to review feedback and writes the evidence-grounded explanation. | Proposed plan to Gemini; calculated evidence and draft report to Gemini; reviewed findings to the person. |
| Gemini 4 Argon | Chief Scientist | Reviews the design and final findings against the supplied methods, measurements, source records and uncertainty. Returns approve, revise or human decision required. | Design feedback to Astra before execution; findings feedback before report delivery. |
| LangGraph | Workflow orchestration and persistent state | Orders the steps, checkpoints completed work, routes review decisions, bounds revision loops and preserves progress when a dependency interrupts execution. | Controls the transition between planning, review, calculations, report and completion. |
| Wolfram Quantum Framework | Mathematical specification and reference checks | Provides the mathematical reference role shown in the workflow. The current continuation retains the saved Wolfram check receipts for the original model. | Checked model definitions and reference calculations inform the matched simulation and hardware interpretation. |
| NVIDIA CUDA-Q | Quantum-program preparation and simulation | Compiles and simulates the defined quantum model. The original study used qBraid GPU simulation; the continuing recipe performs local CPU CUDA-Q checks on the cloud worker. | Compiled programs, simulated observables and numerical-check receipts. |
| qBraid and NVIDIA GPU | Recorded GPU execution route | Executed the saved CUDA-Q compiled programs on the documented GPU service. Those measurements and receipts remain available for comparison. | Recorded GPU samples and execution identity into the study evidence. |
| QuEra Aquila via Amazon Braket | Recorded physical quantum measurement route | The saved analog programs ran on Aquila’s neutral atoms through Braket. Their task receipts identify the actual hardware measurements. | Hardware counts, usable shots, observables and timestamps into the comparison. |
| Biological evidence and classical benchmarks | Test biological usefulness | Reference DNA, ENCODE binding observations and JASPAR motifs support the held-out prediction comparison. Fixed classical code calculates the scores and uncertainty. | Computed biological results and source provenance to Astra and Gemini. |
| Research memory and Universal One | Shared research context and public research conversation | Astra retrieves mission, experiment and research-direction records plus literature from the research repository. Universal One exposes cited research answers and public evidence access. | Versioned sources to the scientific workflow and to an external AI using the public interfaces. |
| Cloudflare broker, AWS worker and encrypted storage | Durable execution and delivery | The broker tracks session-owned tasks and worker leases. AWS Lambda executes the supported recipe; SQLite checkpoints and encrypted S3 preserve progress and results. | Progress events and the completed report return to the originating research session. |
| Stage | Heading | Explanation |
|---|---|---|
| question | Begin with your biological question. | GPT uses the Atlas definitions and saved study recipe to select the calculation. Select a step to inspect its role. |
| model | One model, two matched routes. | Wolfram checks the mathematical specification. The same coordinates, interactions, pulses and measurement conventions feed CUDA-Q and the Aquila program. |
| simulation | Predict the quantum response with CUDA-Q. | CUDA-Q generates the matched simulation. The documented GPU route uses qBraid for supported compiled programs. |
| hardware | Measure the response on Aquila. | Amazon Braket submits the approved analog program to QuEra Aquila. Actual queued, running, completed and failed states belong to a saved task receipt. |
| evidence | Let independent observations test the prediction. | Build and adjust the prediction methods using one set of DNA regions. Then keep the methods unchanged and predict binding on different regions. Compare those predictions with laboratory results kept hidden until the predictions are complete. |
| result | Return the biological finding. | A completed result combines a plain-language finding, uncertainty and an interactive geometry comparison. Methods, source versions and execution receipts remain available on demand. |
The current recipe allows one design revision and one report revision. Unsupported questions or unresolved review decisions pause with a stated dependency. Closing the browser does not cancel a durable task; the saved study can be reopened. Cancellation and resume operate on that research session’s own study.
The current continuation uses the saved GPU/Aquila results and performs new classical and local CPU CUDA-Q calculations. Fresh Aquila jobs, paid GPU jobs and a fresh Wolfram kernel run are outside this recipe. The workflow labels recorded hardware evidence separately from current task progress.
The shared research memory combines mission, research directions, versioned experiments and source-linked literature. Retrieval uses semantic and text search. The report retains the retrieved source context and evidence hashes.
A delivered study contains the original question, plan and provider receipts, review decisions and evidence packets, source provenance, calculations, program checks and complete JSON/CSV. A private task report becomes a public experiment only through the separate reviewed publication process.
The broader swarm prototype includes mid-study scientific support, human-interruption routing and a publication outbox for Synapse and DeSci. Integrating those general adapters into every live recipe, public MCP/A2A study dispatch, optional document destinations and the Drug Discovery Network remain extensions. The live fixed recipe already includes Gemini design and final review.
An external AI can explain the features to its human, retrieve and analyse the public research record, compare methods and help formulate a question. MCP exposes research tools. The REST API exposes the same records as JSON. A2A sends a research question to Universal One and returns its cited answer. The Quantum Atlas interface starts and follows a persistent scientific investigation.
| Route | Purpose | Entry point | Access |
|---|---|---|---|
| Read the Wiki or downloads | Explain the page and its research architecture; discuss a saved study with a person. | https://universalmind.tv/informatics/read/quantum/index.html | Public reading |
| MCP | Give an AI structured tools for study records, geometry, publications and reusable passages. | https://informatics-universal-one.universalmind.workers.dev/mcp | No API key for these public read-only tools |
| REST API | Retrieve exact JSON records from an application, script or AI tool. | https://informatics-universal-one.universalmind.workers.dev/api/v1/openapi.json | Public read-only API |
| A2A | Let an external agent ask Universal One a self-contained research question and receive a cited answer. | https://informatics-universal-one.universalmind.workers.dev/.well-known/agent-card.json | Public interface; shared request limits apply |
| Quantum Atlas research session | Submit a supported investigation, follow Astra/Gemini progress and retrieve the session-owned report. | https://universalmind.tv/informatics/?entry=research&area=quantum | The site establishes the browser research session automatically |
Connection setup guides and client examples
MCP lets an external AI request structured research records as tools inside its own conversation.
HTTP JSON-RPC; responses are JSON. The endpoint accepts application/json and text/event-stream in Accept.
{
  "Content-Type": "application/json",
  "Accept": "application/json, text/event-stream",
  "MCP-Protocol-Version": "2025-11-25"
}| Tool | Purpose |
|---|---|
| get_quantum_study | Read the recorded OXTR Quantum Atlas experiment, sequence definitions, actual measurements, comparison, timing, next test and downloads. |
| search | Find publication and Atlas record IDs. Fetch records before making study-specific claims. |
| fetch | Fetch an approved publication or Atlas overview from a search result ID. Atlas analysis sections are accessible through get_atlas_record; the URL returns the complete record. |
| get_inventory | Exact current counts, dataset version and access scope. |
| search_publications | Search approved publication records. OR within each filter; AND across filters. Paginate using nextOffset. |
| get_publication | Read an approved publication by ID, DOI or PMID. Preserve quotations and evidence status. |
| get_passages | Read CC BY or CC0 full-text passages. Preserve attribution and licence. Other full texts are unavailable through this public connector. |
| list_atlas_records | Search or list all M1–M1001 records or the M9 family. Commentary is searchable. A family result is mathematical, not biological evidence. |
| get_atlas_record | Read Atlas commentary, analysis, probability, hypotheses and nested sequences. Default summary lists section paths. Request a dotted section path for detail. Large objects return field paths; arrays use offset and limit. Full canonical data is available at the returned API URL. |
{
  "jsonrpc": "2.0",
  "id": 1,
  "method": "initialize",
  "params": {
    "protocolVersion": "2025-11-25",
    "capabilities": {},
    "clientInfo": {
      "name": "quantum-atlas-reader",
      "version": "1.0"
    }
  }
}
{
"jsonrpc": "2.0",
"method": "notifications/initialized"
}{
"jsonrpc": "2.0",
"id": 2,
"method": "tools/list",
"params": {}
}{
"jsonrpc": "2.0",
"id": 3,
"method": "tools/call",
"params": {
"name": "get_inventory",
"arguments": {}
}
}{
"jsonrpc": "2.0",
"id": 4,
"method": "tools/call",
"params": {
"name": "get_quantum_study",
"arguments": {
"id": "oxtr-qrc-01",
"section": "summary"
}
}
}{
"jsonrpc": "2.0",
"id": 5,
"method": "tools/call",
"params": {
"name": "get_quantum_study",
"arguments": {
"id": "oxtr-qrc-01",
"section": "measurements",
"offset": 0
}
}
}Read structuredContent when present, otherwise parse the JSON text in content. Check isError and JSON-RPC errors before interpreting a response.
The current MCP tool schema lists eight Quantum sections. The API also exposes continuation, which contains the later classical pilot and local CUDA-Q findings. Retrieve that section through the REST URL below; discover the current MCP schema before selecting a section.
A2A lets one agent send a research question to Universal One and receive its answer with source references.
Discover the public agent card
{
  "Content-Type": "application/json",
  "A2A-Version": "1.0"
}
{
"jsonrpc": "2.0",
"id": 1,
"method": "SendMessage",
"params": {
"message": {
"messageId": "quantum-atlas-explanation-1",
"role": "ROLE_USER",
"parts": [
{
"text": "Read the current OXTR quantum study. Explain its research question, the roles of simulation, Aquila measurements and the classical biological comparison, and what the findings mean for a person considering the next experiment. Cite the source records."
}
]
}
}
}Read result.message.parts for the answer and result.message.metadata.sources for citations. Include the relevant context in each new message.
The current A2A agent returns a direct research answer. Persistent task dispatch, streaming and push notifications are outside its advertised capabilities. MCP and A2A do not submit new Aquila jobs or create the browser’s persistent Astra study.
For a new persistent investigation, help the person frame the question and open Quantum Atlas. The site establishes its research session, submits the question and tracks the resulting study. Keep the public research connector separate from the session-owned execution service.
Retain study IDs, immutable revision URLs, source hashes, provider receipts and review status when moving between agents. Link the evidence that supports the explanation, and preserve the original question throughout the handoff.
Do quantum responses generated from Fibonacci and M9 P24 representations improve our ability to predict transcription factor occupancy around OXTR?
| ID | Representation | Recorded role |
|---|---|---|
| ordinary | Ordinary representation | Same biological descriptors in their original genomic order. |
| fibonacci | Native Fibonacci | Predeclared distance features from native Fibonacci gaps, with the physical base-pair range fixed before labels are inspected. |
| phi | Phi Ratio | Ratios of neighbouring motif gaps; retain physical gaps and distinguish native ratios from modular residues. |
| alpha | Alpha · M9 P24 | Full canonical residue order; never equate 24 period positions with 24 hours or a universal 24-base spacing. |
| beta | Beta · M9 P24 | Canonical 4,8,7,5,1,2 cycle. Six-of-nine membership alone is a broad divisibility feature. |
| gamma | Gamma · M9 P24 | Canonical two-triangle order encoded in time. Shared positions alone do not distinguish Epsilon. |
| epsilon | Epsilon · M9 P24 | Canonical seven-visit path, with the repeated closing point retained. A timed encoding must pass a distinguishability check. |
| shuffled | Matched shuffled representations | Seeded controls preserve feature distributions, pulse duration, energy-scale bounds and input information. |
| Control | Existing explanation |
|---|---|
| fibonacci | Successive Fibonacci ratios approach the Phi Ratio. This is an exact limiting relationship. It does not by itself specify a physical arrangement of atoms. |
| modular | M9 P24 means nine residue classes in a 24-step cycle. The Atlas places period positions on a circle; Gamma and Epsilon visit six equally spaced positions. M1–M1001 lets us compare modular representations. These are mathematical coordinates, not nine physical spatial dimensions. |
| odom | Odom’s construction gives MP/MN = φ exactly: M and N bisect two sides of an equilateral triangle, and the ray MN meets its circumcircle at P. A regular tetrahedron has equilateral faces, so this construction applies within each face. |
| honeycomb | Hales proved that regular hexagonal tiling minimizes boundary length when the plane is divided into equal-area cells. This is a geometric efficiency theorem; it does not establish quantum stability or minimum energy for every physical system. |
| quantum | Working hypothesis: does the hexagonal structure associated with these representations contribute to quantum coherence? A direct test varies pulse ordering and atom geometry independently, with matched controls and a coherence measurement. The Nature study supports Fibonacci-driven quantum effects; it does not establish this geometric mechanism. |
| DNA window | Representation | GPU shots | Valid Aquila shots | Calculated mean (0–1) | GPU mean (0–1) | Aquila mean (0–1) |
|---|---|---|---|---|---|---|
| chr3-8752896-8753152 | ordinary | 100 | 98 | 0.2972165941120539 | 0.3016666666666667 | 0.25510204081632654 |
| chr3-8752896-8753152 | fibonacci | 100 | 99 | 0.2748087531131463 | 0.28 | 0.21717171717171715 |
| chr3-8752896-8753152 | phi | 100 | 96 | 0.2688469682614885 | 0.2783333333333334 | 0.24131944444444445 |
| chr3-8752896-8753152 | alpha | 100 | 96 | 0.28111071249328123 | 0.2833333333333334 | 0.203125 |
| chr3-8752896-8753152 | beta | 100 | 97 | 0.2912929479467206 | 0.2883333333333334 | 0.24226804123711343 |
| chr3-8752896-8753152 | gamma | 100 | 96 | 0.3146403274328215 | 0.29833333333333334 | 0.2638888888888889 |
| chr3-8752896-8753152 | epsilon | 100 | 100 | 0.31770366600623073 | 0.3016666666666667 | 0.2916666666666667 |
| chr3-8752896-8753152 | shuffled | 100 | 95 | 0.28120871076145454 | 0.27666666666666667 | 0.2754385964912281 |
| chr3-8745472-8745728 | ordinary | 100 | 95 | 0.19366276748557543 | 0.21166666666666664 | 0.18070175438596492 |
| chr3-8745472-8745728 | fibonacci | 100 | 97 | 0.19352774497750133 | 0.215 | 0.19415807560137455 |
| chr3-8745472-8745728 | phi | 100 | 96 | 0.19181574999115006 | 0.21499999999999997 | 0.17361111111111113 |
| chr3-8745472-8745728 | alpha | 100 | 95 | 0.1691344536029761 | 0.18000000000000002 | 0.15087719298245614 |
| chr3-8745472-8745728 | beta | 100 | 96 | 0.17618737236750492 | 0.18500000000000003 | 0.16145833333333334 |
| chr3-8745472-8745728 | gamma | 100 | 95 | 0.22444963615407762 | 0.24166666666666667 | 0.17368421052631577 |
| chr3-8745472-8745728 | epsilon | 100 | 97 | 0.2544423008082389 | 0.26333333333333336 | 0.16494845360824742 |
| chr3-8745472-8745728 | shuffled | 100 | 93 | 0.267420073461925 | 0.26166666666666666 | 0.29032258064516125 |
| Model | OXTR average precision | OXTR ROC AUC |
|---|---|---|
| ordinary motif and spacing | 0.0719144453117206 | 0.5963541666666667 |
| with Fibonacci and Phi Ratio | 0.07390237208980502 | 0.6145833333333334 |
QUANTUM ATLAS
Simplifying Quantum Computing and Bioinformatics.
Natural Language In. Biological Insights Out.
No quantum expertise needed. Start with our OXTR study or describe your investigation.
Ask a question to begin.
Mathematical reference · study measurements are recorded separately.
EXPLORE WHILE YOU WAIT
Switch between Alpha, Beta, Gamma and Epsilon. Compare their positions and paths while your results collect in the next two steps.
This view shows the mathematical representations. Measured results appear in Classical results and Quantum results.
ASTRA · YOUR INVESTIGATION
Study 01 uses a reusable quantum reservoir template. All input encodings, model settings and evaluation rules are frozen before the final test. Biological findings come from the recorded calculations and measurements.
Read the first measurement record ↗
Read the full study protocol ↗ · Save the study specification ↓
CUDA-Q specifies the simulation; qBraid provides the GPU route for compatible compiled programs. Amazon Braket routes the analog program to QuEra Aquila. D-Wave Leap is a separate annealing route for future validated templates. Each route retains its own model and execution receipt.
Names identify the technologies in the workflow; no partnership or endorsement is implied.
03 / CLASSICAL RESULTS
Approximately 5–10 minutes from the start of processing.
04 / QUANTUM RESULTS
Timing varies with the quantum queue. Results appear here after processing and checks.
05 / FUTURE FEATURE
Extend the investigation beyond the calculation. Our roadmap connects recorded results and preliminary AI insights with external research platforms, with human review before sharing.
Roadmap · the long-term aim is automated collaboration with human oversight. This stage has no active external submission or publishing connection.
THE TECHNOLOGY BEHIND YOUR QUESTION
Begin with your biological question.
Select a step to explore its role. The status labels track the study; motion illustrates the workflow.
OUR OXTR STUDY · THE STORY SO FAR
From our first CUDA-Q and Aquila measurements to Astra’s genomic analysis: one continuing investigation into Fibonacci, Phi Ratio and M9 P24.
Completed 25 October 2026 · Next quantum batch awaits a funding decision.
STAY OR RETURN
Both completed study phases are ready to explore above. For a new calculation, stay with the geometry or return later as results become available.
Classical: approximately 5–10 minutes. Quantum: timing varies with device availability and queue.
The 25 October 16-run OXTR batch: 16 minutes 51 seconds from the first submission to the final completion. The first result arrived after 3 minutes 16 seconds.
The earlier two-atom test: 18 hours 52 minutes, submitted on 24 October and completed on 25 October. Both experiments are complete. These are observed timings, not promised delivery times.
Delivery preference for the upcoming study run. Email is confirmed at launch; this preview saves your preference on this device.
THE SCIENCE COMES FIRST
Begin with a biological task. Our first study focuses on transcription; the same natural-language approach can expand to other validated research workflows.
01 / GENE REGULATION
Compare binding patterns and rank candidate sequences, with experimental evidence kept alongside predictions.
02 / GENOME ASSEMBLY
Find a consistent ordering of short reads and inspect the reconstructed sequence. Begin with a small, transparent example.
03 / GENETIC VARIATION
Explore how genetic variants can be assigned to distinct chromosome copies, and what data make that assignment reliable.
04 / MOLECULAR INTERACTIONS
Select compatible candidate contacts in a molecular model, then assess their biological relevance with independent methods.
These are research directions with specific mappings and limits. A quantum formulation alone does not establish better accuracy, faster computation or biological validity.
GROUNDED IN PUBLISHED WORK
Read the findings, their scale and their limitations. Simulation, quantum hardware and classical results remain clearly identified.
RESEARCH STIMULUS · NATURE, 2022
Laser pulses arranged in a Fibonacci pattern extended the stability of information stored in a quantum computer’s atoms. This finding motivates our investigation and future experiments with Fibonacci representations.
WORKING HYPOTHESIS
Does the hexagonal structure in our Fibonacci representations contribute to the stability of quantum information?
Solid geometry: mathematical relationships. Dotted link: a proposed physical mechanism. The current Aquila batch measures responses in one fixed hexagon; it does not compare geometries or measure coherence lifetime.
SCIENCE AS A PUBLIC SERVICE
Our aim is a publicly funded service that scientists can use freely within shared daily, weekly and monthly budgets. Access follows available capacity, without individual research approvals.
Small research demonstrations use shared trial and funded compute. The first OXTR run uses a recorded study budget shared across its CUDA-Q and Aquila calculations.
QUESTION CAPACITY
These counters cover AI questions. Study compute has a separate cost record. Daily, weekly and monthly compute limits form part of the execution design.
LLM Benchmarking Project (opens in a new tab)
Track how language models perform at translating English instructions into correct Wolfram Language code over time. This informs model assessment for our work with the Wolfram Quantum Framework. Each quantum program still needs direct calculation, simulation and evidence checks.
SCIENTIFIC REVIEW
OXTR · STUDY 01
DUMITRESCU ET AL. · NATURE 607, 463–467 · 2022
Laser pulses arranged in a Fibonacci pattern kept quantum information stable for longer in the atoms of a quantum computer.
These observations concerned the edge qubits of a ten-ion processor. The Fibonacci-driven information remained coherent for the full 5.5-second observation period. The 1.5-second comparison is specific to that experiment, not a universal qubit lifetime.
The authors attribute the protection to symmetries emerging from the pulse ordering. Their experiment did not test a hexagonal atom arrangement or M9 P24.
Quantum Atlas investigates the hexagonal and triangular structures in Fibonacci’s modular representations across M1–M1001. We are exploring whether those relationships have measurable consequences in quantum systems, using Fibonacci, Phi Ratio, Alpha, Beta, Gamma and Epsilon. OXTR DNA supplies the first biological test inputs.
The geometric mechanism illustrated below is our working hypothesis. Odom’s construction and the honeycomb theorem establish mathematical relationships; a connection to quantum coherence remains to be tested.
Enable JavaScript to explore a question. Read the research references.
Vision Atlas
Explore visual and ocular biology, light exposure, gene expression and the EMDR literature.
Saccadic · Hexagonal
Bilateral
Research comparison · hypothesis under investigation
Are hexagonal animations more natural, human, and impactful for EMDR visual stimulation than traditional horizontal tracking green lights? We use the honeycomb conjecture as inspiration, where hexagonal packing is nature's most efficient division of space. Furthermore, many endogenous neurotransmitters, hormones, and nucleic bases natively utilise hexagonal configurations within their molecular architecture.
We hypothesise that a hexagonally structured saccadic tracking pattern imposes a distinct oculomotor and visual psychophysics load compared to standard linear tracking. We propose that the complex coordination required to navigate this geometric pattern optimises retinal and visual pathway signalling, thereby driving a downstream biological response that upregulates OXTR gene transcription (measured via mRNA sequencing) and enhances emotional regulation.
THE SCIENCE BEHIND THE GEOMETRY
Several groundbreaking publications across the Nature portfolio explain why the human visual pathway preferences—and utilizes—hexagonal grids and equilateral triangles (which are geometrically the core component of hexagons).
Rather than viewing these shapes as an aesthetic preference, neuroscience and optical physics reveal that our eyes and brains are wired around them for mathematical optimization, sampling efficiency, and structural economy.
The primary explanations are found in the following core areas:
Illustrative geometry · cell centres and their neighbours
01 / RETINA
Optimal Sampling
At the very beginning of the optical pathway, the light-sensing cells in the human eye arrange themselves into a tight, hexagonal lattice.
The "Why": Mathematically, if you pack circles (like photoreceptor cells) as closely together as possible on a flat or curved surface, their centers naturally form a lattice of equilateral triangles that tessellate into a hexagonal pattern. This provides the highest possible packing density with zero wasted space.
The Nature Connection: A detailed overview in Nature: Eye notes that cone inner/outer segments reach up to 300,000 cells/mm² in the fovea (the center of our sharpest vision). This incredibly dense, hyper-uniform hexagonal arrangement is what allows the human eye to reach the absolute physical upper limits of visual acuity.
Illustrative moiré model · two overlapping lattices
02 / VISUAL CORTEX
Moving deeper into the brain, research published in Nature and PMC explains how the brain creates "orientation maps"—the neural columns that allow us to detect the angle and direction of lines in our environment.
The "Why": A prominent study on the Retinal origin of orientation maps in visual cortex demonstrated that the primary visual cortex (V1) maps out angles using an underlying hexagonal grid.
The Mechanism: The brain receives two separate hexagonal arrays of information from the retina: "ON-center" cells (detecting light) and "OFF-center" cells (detecting dark). Because these two grids have slightly different spacing, they overlap to create a Moiré interference pattern. This interference generates a hexagonal lattice of "pinwheels" in the brain, allowing us to seamlessly process all 360 degrees of structural orientation.
Illustrative spatial grid · six directions, 60° apart
03 / SPATIAL CODING
Once visual information passes from the visual cortex into areas responsible for navigation and memory (like the entorhinal cortex), the brain maps out visual space using a perfect hexagonal coordinate system.
The "Why": A landmark study published in Nature Neuroscience discovered "hexadirectional coding"of visual space.
The Mechanism: When your eye scans a scene, certain cells known as "grid cells" fire in a strikingly symmetric, six-fold rotational pattern. If you plot the locations where these neurons fire when tracking gaze, they outline the vertices of interconnected equilateral triangles, forming a continuous hexagonal grid over our visual field. This architecture functions as the brain's internal metric system, providing the most energy-efficient way to calculate distance and location.
THE CONNECTING IDEA
In short, the optical pathway preferences these shapes because hexagons enclose the maximum area with the minimum perimeter, while equilateral triangles are the most rigid and stable way to divide that space. From the physical packing of cells in your retina to the computational firing of neurons in your brain, this geometry is used because it requires the absolute minimum amount of metabolic energy to transmit the maximum amount of visual data.
Inspired by research into how geometric architectures and Fibonacci-ordered dynamics can protect quantum information, we are investigating whether geometry derived from Fibonacci Pisano periods can improve the computational efficiency of hyperspectral image analysis for genomics.
Our proposed approach explores equilateral triangular meshes and tetrahedral models, comparing computational cost, processing speed and accuracy against established methods.
The initial biological application is to investigate spectral patterns potentially associated with OXTR gene expression, evaluated against independent molecular measurements.
Language Atlas
From mantra and meditation to communication, psychotherapy and epigenomics.
Explore the original Mantra collection alongside recent molecular and clinical research.
Active recitation, mental practice and mindfulness, with gene expression, methylation and physiological outcomes identified separately.
Research on psychotherapy and molecular change, including trauma-focused therapy, cognitive behavioural therapy and narrative exposure.
A developing research question: how do interpersonal experiences relate to our epigenome? Whole-treatment associations remain distinct from effects of particular words.
Our priority is transcription factor binding sites in the DNA that regulates the oxytocin receptor gene, OXTR.
A transcription factor is a protein that recognises particular DNA sequences and helps regulate gene activity. A binding site is a short stretch of DNA where that recognition takes place.
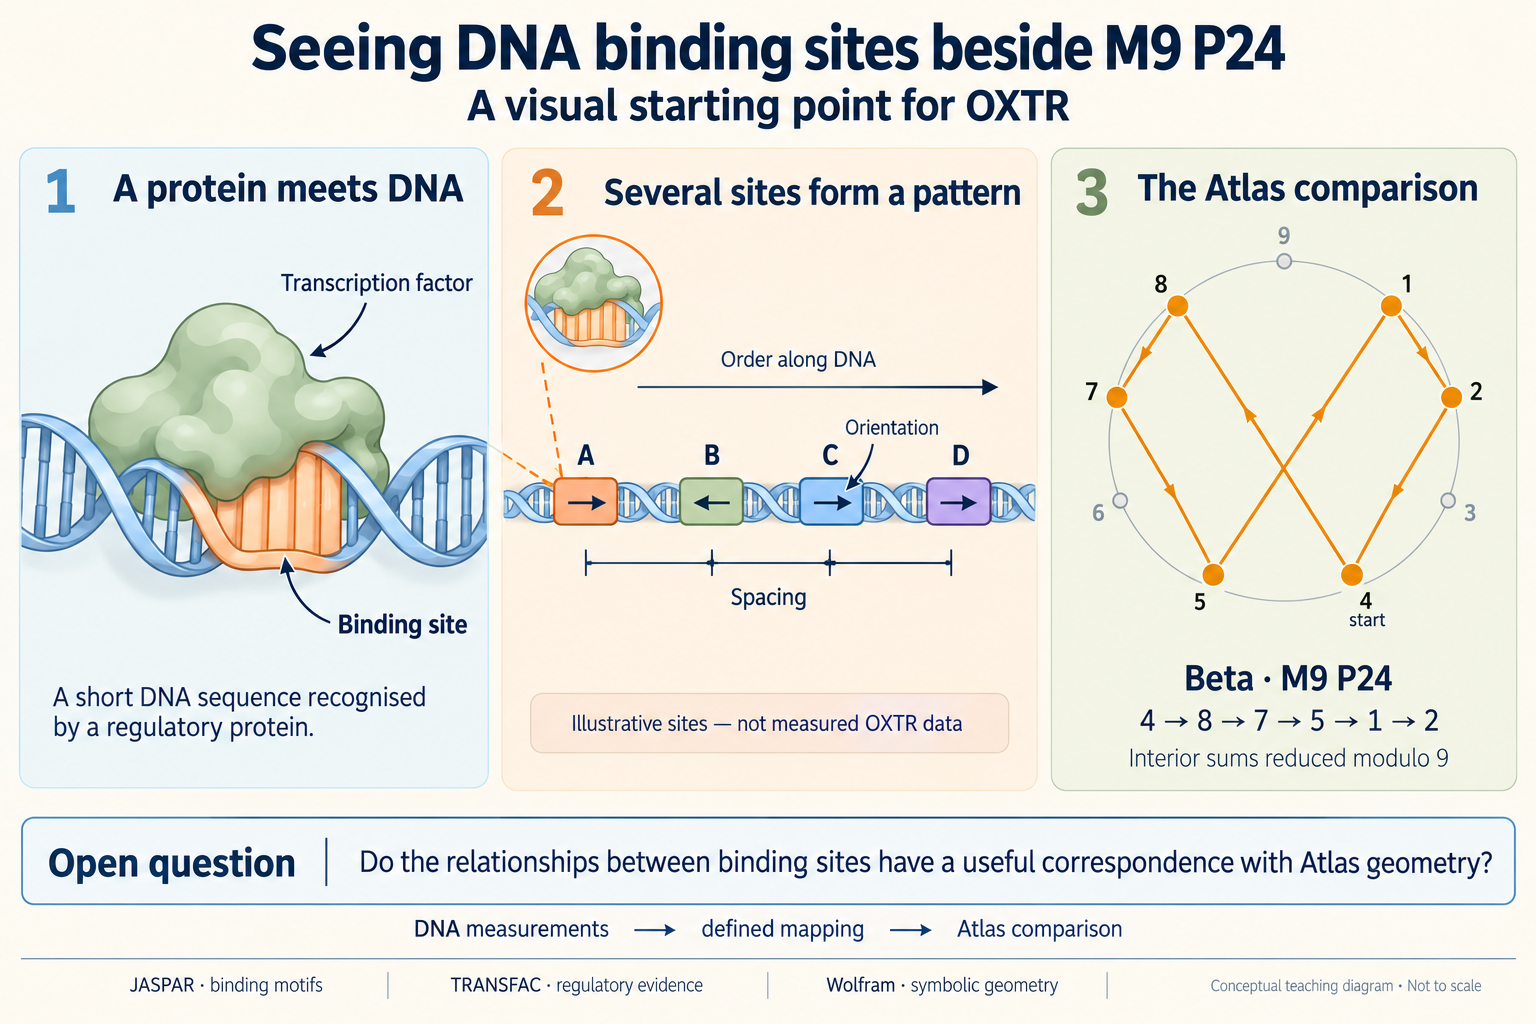
The DNA sites are illustrative. The arrows on them indicate motif orientation along DNA. The Beta diagram presents the Atlas pattern beside the biological idea; the mapping is the research step ahead.
The 15 sites, ENCODE clusters and predicted matches
The 15 sites
One OXTR promoter study reported 15 candidate binding locations using sequence analysis and laboratory binding tests. This is one study’s set, not a total for every region and cell type.
An ENCODE cluster
An experimental neighbourhood where a protein was detected associating with DNA. It usually covers a wider region than the exact binding sequence. The underlying experiments and cell types are linked in the catalogue.
A predicted match
A computer finds a DNA sequence resembling a protein’s preferred binding pattern. It is a candidate location to investigate; matching the pattern alone does not demonstrate binding in a cell.
Several predictions and experimental regions can overlap the same piece of DNA. These are complementary types of evidence, so their counts remain separate.
The 15-site study · ENCODE methods · JASPAR documentation
THREE VIEWS OF THE SAME DATA
Original DNA line → Full-position circle → Modulus 9 circle
The interactive experiment can show how the same positions appear in each view, making the preserved relationships and the effects of compression visible.
Several regulatory sites can influence the same gene. Their use depends on the proteins present and the cell’s conditions; there is no single required number of sites or universal binding order.
Multiple inputs. Proteins at different DNA sites help regulate the same gene.
Repeated copying. One binding event does not automatically mean one RNA copy.
Two kinds of binding. Transcription factors bind DNA. Oxytocin binds the receptor protein.
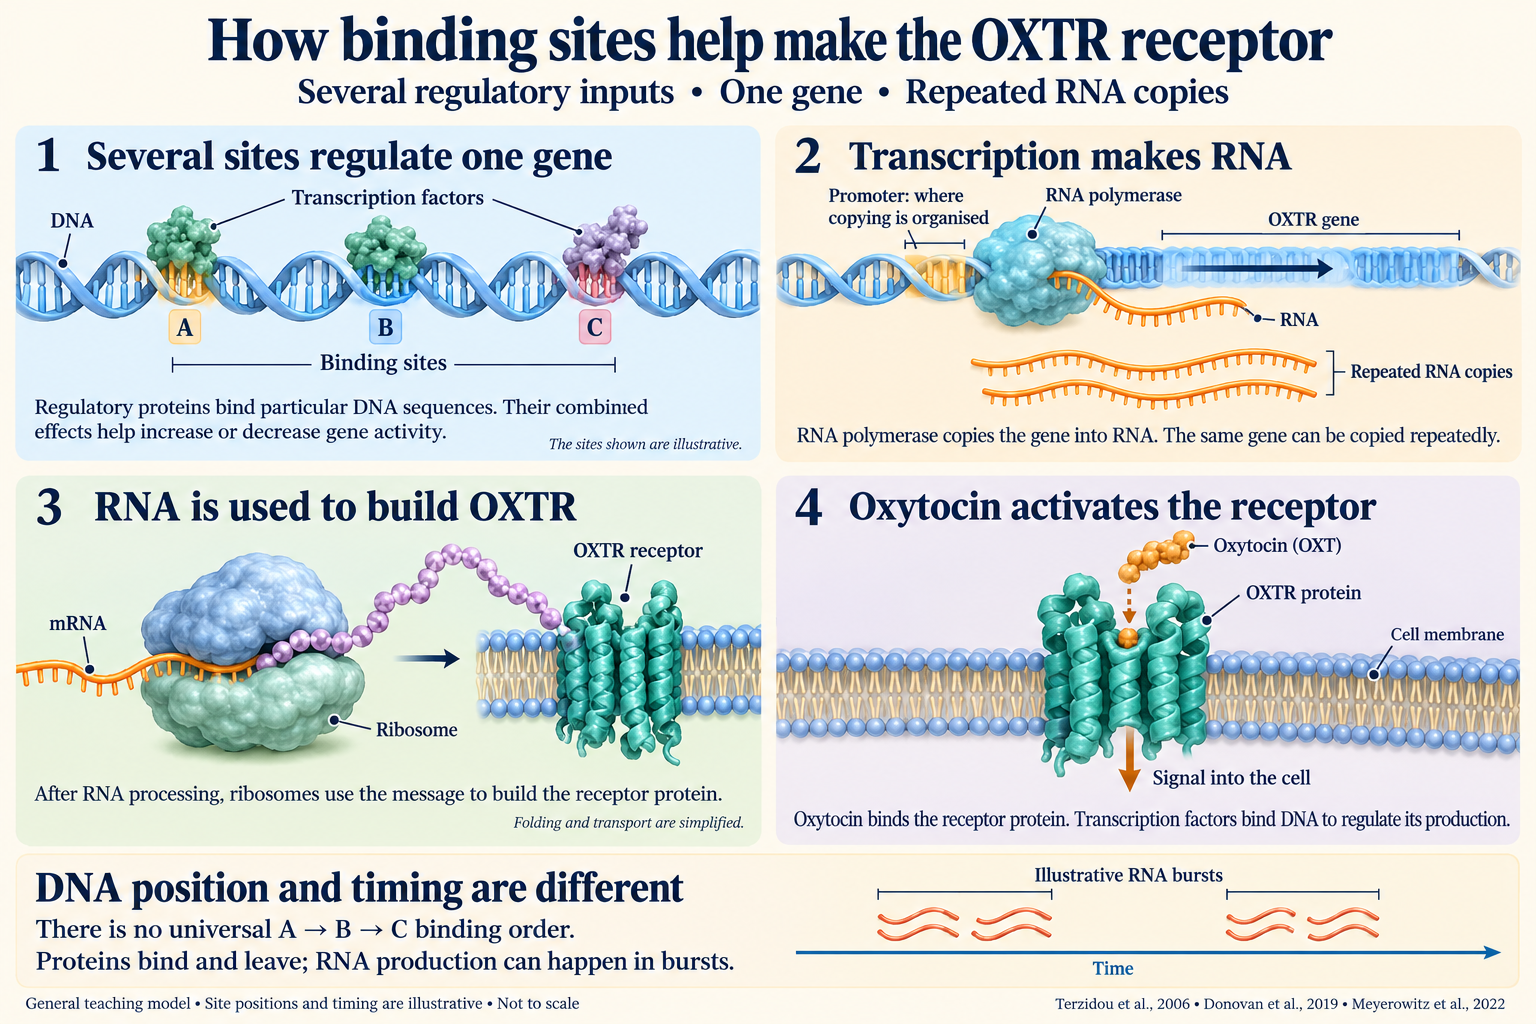
This is a general teaching model. The illustrated sites, timing and RNA bursts are not measured OXTR data. Folding and transport are simplified.
OXTR promoter research · Binding and RNA bursts: a yeast study · Oxytocin–receptor structure
COMPARE POSITIONS · OXTR
Explore whether the four M9 P24 geometries help predict OXTR binding-site locations. Compare DNA observations with the original Atlas geometry side by side. Blend adds the selected geometry to the DNA panel.
Same 39,248-base window for every source · OXTR gene + 10,000 bases on each side
Inspect the observations
Mapping & verification
Fixed human OXTR window: GRCh38 chr3:8,740,380–8,779,628 (0-based, end-exclusive). The direction follows OXTR’s minus strand, from high to low genomic coordinates. The origin is the window edge, not the transcription start site.
The line and full circle retain interval widths. For M9, one central base represents each interval within this window. An even-width interval uses the first central base in the OXTR direction. Regions extending beyond the window are clipped for display; their original coordinates remain in every export.
d = floor((offset_start + offset_end − 1) / 2) Full circle = d / 39,248 turns · M9 = d mod 9 Zero is displayed as 9. All circles start at north and run clockwise. Compression merges positions; node counts expose those overlaps.
The Atlas reference keeps its original grid and phase: Alpha, Gamma and Epsilon use 24 period positions; Beta uses nine residue positions. The shared circle aligns both layers at north, clockwise, with no fitted rotation. On the full-position circle, one DNA window fills one turn. On the line, Atlas turn × window length gives the guide position; only node positions are shown, without connecting curves. In M9, the DNA has nine residue positions while each Atlas guide retains its native grid. A shared angle does not equate a period index with a residue. The Atlas paths show geometry, not measured movement or binding order.
The browser filters and draws precomputed results. Python/Biopython and Wolfram are used in the reproducible preparation and verification, rather than called as live services for each selection.
Initial visual experiment · statistical association has not yet been tested. No negative binding controls have been curated for this map; an unrecorded position is not a failed binding test.
Three sources, with different kinds of evidence. Their counts describe different things.
Findings from papers
Individual research papers investigating how the OXTR gene is regulated.
DNA elements + human brain occupancy
128study observations
Two sequence-mapped elements and 126 screened BrainTF occupancy records. All 128 are available in the interactive comparison and data browser. The enhancer study adds functional reporter evidence.
Laboratory measurements
A research project and public database of experiments that map how genes are controlled.
Experiments in cells → DNA regions
255experimental DNA regions
A region is a stretch of DNA with protein-binding evidence. It can contain several sites; its centre is not a confirmed binding site.
Computer predictions
A library of DNA-binding patterns learned from experiments. Computers search DNA for matches to these patterns.
Binding patterns + DNA search → matches
9,164predicted sequence matches
A match is a candidate binding location. The prediction alone does not establish that a protein bound there in a cell.
Studies · human brain occupancy and enhancer activity
126 screened ChIP-seq observations overlap our OXTR window, covering 43 protein targets and 13 brain contexts. Of these, 114 overlap the defined proximal promoter.
The selection requires an author replication pass, both FRiP values at least 1%, an author NOT-HOT classification and consistent target metadata. The 1% filter is an Atlas review choice. These are regional occupancy measurements; the experiments share four donors across regions.
BrainTF publication · Author data and analysis
Human OCE7 DNA enhanced reporter activity in mouse hypothalamic cells and drove reporter activity in mouse olfactory bulb. This provides functional evidence; it does not identify a particular transcription factor or prove regulation of native human OXTR.
The reported candidate interval and luciferase-primer span differ. Both are retained in the downloads, with no precise binding-site overlay assigned.
All 128 mapped observations are available in the Studies comparison below. The enhancer findings are in Literature & study evidence; they do not identify precise transcription-factor binding sites.
A short DNA sequence recognised by a regulatory protein, called a transcription factor.
A stretch with evidence of protein association. The dashed centre is a plotting position, not an identified binding site.
DNA sketches illustrate the distinction; they are not measured OXTR sequences or drawn to scale.
Start with a positive binding result at a defined DNA sequence. “Tested” alone does not tell us whether binding happened.
Binding detected at a defined sequenceA positive binding result at a specified DNA sequence is the most direct anchor for a location comparison. Check the protein, assay and biological context.
Protein association detected across a regionENCODE and BrainTF supply experimental support over a stretch of DNA. Resolve the site within it and inspect the contributing cell types and experiments.
Sequence match predictedJASPAR matches are candidates for exploration and experimental follow-up. A model match alone does not establish binding at that location.
Did it change gene activity? That is a separate result, recorded alongside binding. A relevant cell type, good experimental controls and replication strengthen the evidence.
A paper can report any of these evidence types. These priorities describe biological support; the significance of a geometric match needs its own statistical test.
Human sites and overlap checks
The human collection includes 20 records with laboratory tests and 9 with functional evidence. These categories overlap and include regional and grouped findings.
US-1 and US-2 each match once in our saved OXTR reference window. Their original sequences, computed GRCh38 positions and overlap links are included in the shared data.
The original 15 sites are from a human study. Their individual sequences and historical positions still need recovery from the full paper and any supplementary tables.
All imports now share a common observation format. Identical reference intervals are grouped while every source observation remains available. Overlapping regions are linked; overlap alone does not establish the same binding site.
The complete packages also contain the unified observations, reference intervals, source relationships and overlap tables. A total of unique confirmed human sites remains open. The interactive coordinate experiment above retains these original observations.
Region, database coverage & next steps
Human reference window: GRCh38 chr3:8,740,380–8,779,628, using 0-based, end-exclusive coordinates. This covers the annotated OXTR gene and 10 kb on each side. OXTR is on the minus strand.
All 217,857 returned JASPAR predictions are retained in the downloads; 9,164 pass UCSC’s default score ≥400 display filter. These are motif matches, with overlapping models and positions. The filter does not establish biological activity.
The downloads include reference DNA, 1,019 vertebrate motif templates, experimental provenance and 37 regional ORegAnno annotations. ENCODE clusters describe broad occupancy, including coregulators. Neither regional overlap nor motif matching alone establishes OXTR regulation.
JASPAR 2026 · Collected 9,164 meet UCSC’s default score >=400 display threshold. All 217,857 returned predictions are retained. Several models and strands can overlap one location. Score is a motif-match statistic, not an OXTR regulatory probability.
ENCODE 3 / UCSC · Collected 133 assayed targets across aggregated experimental contexts. Includes coregulators; not 133 confirmed OXTR-regulating TFs. Provenance joins each cluster to its experiment and cell type.
ORegAnno / UCSC · Collected Annotation class and factor are unresolved for most returned rows. Regional overlap alone does not establish OXTR regulation.
TRANSFAC · Licensed access pending Public product documentation reviewed. No licensed export or redistribution permission available; no protected entries copied.
TFBSdb · Legacy endpoint unavailable Indexed OXTR page returns HTTP 404. Search snippets are not imported as a verified database export.
ReMap · Resource identified; locus export pending No additional ReMap records counted in this release.
ChIP-Atlas · Resource identified; locus export pending Gene-target associations and precise binding intervals are distinct; no extra sites counted.
Wolfram · Planned analysis resource A future analysis tool, not an experimental binding-site source.
Broad web and bibliographic discovery plus selected primary-source review. This is a documented first collection, not a completed systematic review or a census of every OXTR regulator. Genome-wide distal elements, all cell states and all databases remain outside its scope.
The experiment above presents the DNA line, full-position circle and Modulus 9 view. The coordinate calculations have been checked; a biological association with Atlas geometry has not yet been tested.
Literature & study evidence · 45 catalogue records from 26 publications
These 45 literature records describe findings from 26 papers. They are separate from the 128 mapped observations above: one BrainTF literature record links to all 126 of its mapped regions. Some papers report groups, functional assays or positions that remain unresolved.
Filter counts refer to literature records, and evidence categories overlap. Species refers to the DNA studied: the 2025 enhancer paper uses human DNA in mouse cells and mice. Animal Oxtr findings remain available here; they are not placed on the human GRCh38 comparison.
What the evidence filters mean
Laboratory tested includes positive, negative and mixed results. Binding evidence includes both defined sequence elements and regional occupancy. Functional evidence describes a measured regulatory response.
A record can appear in several evidence filters. Original catalogue labels remain in Methods & interpretation and the exports.
Laboratory tested
The record reports a laboratory assay. Includes positive, mixed and negative results; a group-level test does not resolve every member.
Binding evidence
Reported DNA binding or regional occupancy, at the resolution and in the system stated by the source.
Functional evidence
An element, region or element-based reporter has an experimental regulatory response. This does not imply every nucleotide or predicted motif was independently validated.
Annotation or prediction
Sequence or database annotation; direct binding is not established by the annotation alone.
Regulatory context
Evidence concerning gene regulation without an independently resolved binding site in this record.
Scroll the table horizontally to read each source.
Unknown positions remain unfilled. Source review depth is stated for each paper; trust scores for this collection are unassigned. The existing 14-study research register remains a separate collection, with shared papers cross-referenced.
M1–M1001 · core calculations verified
24 native Fibonacci residues on the period circle.
9 · 1 · 1 · 2 · 3 · 5 · 8 · 4 · 3 · 7 · 1 · 8 · 9 · 8 · 8 · 7 · 6 · 4 · 1 · 5 · 6 · 2 · 8 · 1
Clock position 24 is north. Remainder zero is displayed as 9.
Fibonacci recurrence modulo 9. The initial state (0, 1) first returns after 24 steps.
Interior interval sums on the native 9-position circle.
4 → 8 → 7 → 5 → 1 → 2
Original start: 4. Recognised doubling cycle: 1 → 2 → 4 → 8 → 7 → 5.
Interior sums: 4, 17, 16, 23, 10, 11. Modulo 9: 4, 8, 7, 5, 1, 2. First interval: clock positions 24 to 4. Endpoints excluded; wraparound included. Original phase is preserved.
Primary nodal geometry.
9 · 3 · 3 · 9 · 6 · 6
Clockwise node order, starting from north.
Clock positions: 24, 4, 8, 12, 16, 20. The primary selection uses native residues divisible by three, including zero. Regular triangles are drawn only when their vertices lie in this node set. Additional formations are available in Geometry summary.
A continuous unicursal hexagram through 3, 6 and 9.
9 → 3 → 6 → 9 → 3 → 6 → 9
Arrows indicate direction; small numbers indicate visit order.
Clock position route: 24 → 8 → 20 → 12 → 4 → 16 → 24. Proposed geometric traversal; physical interpretation remains unassessed.
Native sequences and detected primary geometry in one frame.
Alpha · Beta · Gamma · Epsilon
Alpha uses 24 positions; Beta uses 9.
Only detected primary triangles and hexagons are drawn. Shared placement is a drawing convention and does not establish biological significance.
Research hypothesis
We hypothesize that the unicursal hexagram may describe a sequence of valence-electron transitions. We plan to investigate this through Hamiltonian modelling, initially exploring quantum annealing with D-Wave Leap.
Odom’s construction uses the Phi Ratio to circumscribe a circle around an equilateral triangle.
Join the midpoints A and B of two sides of an equilateral triangle.
Take AB as one unit.
Extend AB beyond B by 1/φ to reach C on the circle through the triangle’s three vertices.
AB divided by BC equals φ. So does AC divided by AB. The yellow labels use AB as 1, making BC equal to 1/φ.
The Phi Ratio is the limit of the ratio of successive Fibonacci numbers. As the sequence continues, each number divided by the previous number approaches φ ≈ 1.618034. Odom’s construction expresses that same ratio geometrically.
This construction applies to every equilateral triangle. Whether it helps explain patterns across Fibonacci moduli remains a research question.
Shared arithmetic. Distinct native geometries.
M9 family identifies multiples of nine, not a significance ranking.
Original phase is preserved. Beta begins at 4; its recognised cycle is 1 → 2 → 4 → 8 → 7 → 5. Zero residues are displayed as 9 after reduction.
Why the sequences match
For multiples of nine, (Fₙ mod 9k) mod 9 = Fₙ mod 9. Gamma selection and interior sums preserve this reduction. This is an exact arithmetic relationship.
All 111 multiples of nine through M999 passed the Python sequence comparison. Longer periods contain repeated M9 cycles; their full-circle geometry is not necessarily identical.
Research question · not yet assessed
A CONNECTED RESEARCH COLLECTION
Eight starting points. Explore their genes, protein structures, and source evidence.
The collection groups research subjects. Spatial arrangement does not imply a physical interaction.
Backbone and base rings from the atomic model.
Exons in gold · introns between · 5′ → 3′
The selected sequence, built as an ideal B-DNA atomic model.
Choose a construction and enable the geometry layer.
PHI RATIO φ = 1.618033…
Explore oxytocin at its receptor, from the complete complex to the aromatic contact.
Bound pose · experimental coordinates
Tilted Tyr2–Phe291 contact. Gold dashes measure a gap, not a chemical bond or an electron path. Pale green dashes mark the Tyr2–Leu316 hydrogen-bond contact.
The lobes and motion guides are schematic. Colour shows orbital sign, not electrical charge. Ring hydrogens are implicit.
Explore calculated orbitals around a Tyr2–Phe291 fragment pair.
Orbital amplitude · Bohr⁻³ᐟ²
Oxytocin is a cyclic peptide with the sequence CYIQNCPLG–NH₂ and a Cys1–Cys6 disulfide. Tyr2 sits deep in the receptor pocket.
Gold dashes are a distance guide between the closest ring carbons, not a chemical bond or an electron path. Pale green dashes identify the Tyr2–Leu316 hydrogen-bond contact. Distances use the deposited heavy atoms. Ring angles use least-squares planes through the six ring carbons. Structural resolution and model uncertainty limit their interpretation.
The final bound pose uses 7QVM coordinates. The approach is a rigid, illustrative translation along an outward vector. It is not a molecular-dynamics trajectory, docking search, free-energy calculation or observed entry pathway. Only the bound pose displays contact measurements.
7QVM is an engineered human receptor complex determined by cryo-EM at 3.25 Å. G protein and antibody components are omitted from this view.
The regular phenol ring and peptide attachment cue help explain the tyrosine side chain. They are idealised teaching geometry, with ring hydrogens implicit.
Each aromatic carbon contributes a p orbital perpendicular to the ring plane. The two lobes have opposite wavefunction signs. Their colours do not represent positive and negative electrical charges.
Moving markers guide the explanation. Their number, route and speed are symbolic, not electron counts, electron trajectories or physical timescales. No stimulus or time-dependent calculation is being simulated.
The separate Calculated mode retains the PBE0/def2-SVP fields for the capped Tyr2–Phe291 fragment pair. The teaching geometry does not replace those data.